
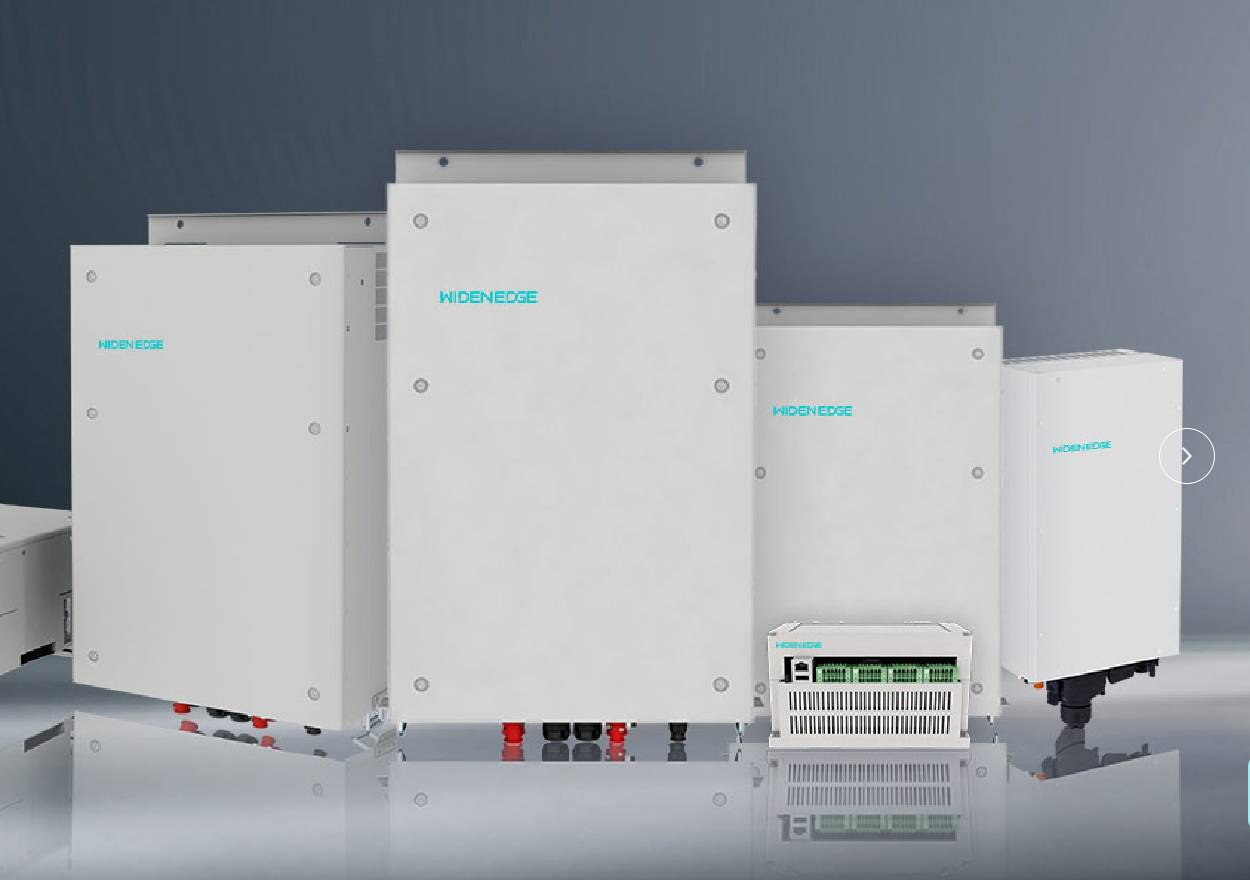
Data-driven premise and scope
Remote monitoring must answer measurable questions: what to measure, at what resolution, and how those measurements guide operational choices. This analysis treats monitoring as a quantitative instrument for asset management across commercial battery backup systems and for validating a broader power system solution. Field deployments in California demonstrate how telemetry informs outage mitigation, resource dispatch, and regulatory reporting. The following sections enumerate the data points, analytic treatments, and governance practices that convert raw logs into operationally useful intelligence.
Essential real-time telemetry
Capture these signals continuously; they form the primary dataset for immediate control and short-term forecasting.- Voltage: per-module and per-string measurements; phasing and balancing anomalies appear here first.- Current: charge/discharge direction and rate; use ±A with sign convention.- State of Charge (SoC): internal estimation from coulomb counting and voltage signatures; sample at 1–10 s for control loops.- State of Health (SoH): derived metric (capacity fade, internal resistance); update hourly or after cycling events.- Cell and enclosure temperature: high-resolution for thermal runaway detection; sample 1–10 s where thermal gradients are expected.- Insulation and ground-fault indicators: safety-critical binary/trend signals.- Power (kW) and energy throughput (kWh): instant power and cumulative energy for billing and utilization metrics.- Grid interface signals: frequency, phase angle, and point-of-interconnection voltage for anti-islanding and synchronism checks.- Auxiliary measurements: HVAC status, breaker positions, cooling fan RPMs, and environmental sensors (humidity).
Sampling strategy and temporal aggregation
Design sampling tiers by control horizon.- Sub-second to 10-second samples: protection and fast control loops (voltage, current, temperature).- 1–60 second samples: supervisory control and dispatch (SoC, power).- 1–60 minute aggregates: trend and efficiency calculations (SoH, round-trip efficiency).Store raw high-frequency traces for a short retention window (days) and retain aggregated metrics (hourly, daily) for long-term analysis (years). Timestamp all records in UTC and include source identifiers to permit multi-site synthesis.
Analytics, KPIs, and anomaly detection
Convert telemetry into operational decisions using quantitative analytics.- Key performance indicators: availability (% uptime), utilization (kWh charged/discharged per kW nameplate), calendar and cycle capacity fade (%/year), round-trip efficiency (%).- Anomaly detection: baseline models (rolling medians, seasonal decomposition) plus residual-based thresholds detect drift; complement with simple physics-based invariants (energy in minus losses equals energy out).- Trend analysis: linear and non-linear fit to capacity fade and resistance increase; require confidence intervals before declaring degradation.- Event attribution: correlate grid events (frequency excursions, voltage sags) with battery response to separate external stressors from internal faults.
Alarm logic and decision rules
Define deterministic and probabilistic triggers to limit nuisance alarms and ensure timely action.- Safety-critical alarms: immediate action required (thermal runaway signs, ground fault) — hard trip and operator alert.- Performance alarms: threshold breaches for SoH or capacity decline — require inspection scheduling.- Predictive alarms: model-derived probability of failure within a planning horizon (e.g., P(failure)<0.05); prioritize maintenance based on risk ranking.Document escalation paths and measurable remediation steps for each alarm class; record actions and outcomes to close the feedback loop for future model calibration.
Data quality, security, and interoperability
Reliable analysis depends on trustworthy data and seamless system interfaces.- Validation: implement range checks, plausibility tests, and cross-signal consistency checks (e.g., SoC vs. integrated current).- Security: encrypt data-in-transit, authenticate devices, and log access to telemetry to satisfy audit requirements.- Interoperability: adopt open APIs and standardized payload schemas (time-series with metadata) so BMS, SCADA, and enterprise asset management tools can share metrics without bespoke adapters.
Operational pitfalls and mitigations
Common mistakes undermine monitoring value and are straightforward to prevent.- Pitfall: sparse sampling that misses transient faults. Mitigation: tiered sampling strategy with short retention for raw traces.- Pitfall: overfitting predictive models to a single site. Mitigation: train on pooled datasets and validate across different installations.- Pitfall: treating SoC as a single ground-truth value. Mitigation: maintain multiple SoC estimators and reconcile discrepancies.- Pitfall: ignoring environmental context. Mitigation: correlate performance with ambient conditions and grid events.
Concluding synthesis
Precision in telemetry selection, disciplined sampling, and rigorous analytical treatment yield operational clarity: they let operators identify safety events, prioritize maintenance, and quantify asset health. These capabilities arise from combining device-level signals with domain-aware analytics and robust governance. For stakeholders seeking systematic monitoring that links field evidence to operational decisions, the described framework aligns with what practitioners report from deployed sites and supports cohesive integration with solutions such as WidenEdge.